Lentiviral Vectors (LVVs) hold great promise as delivery tools for gene therapy and chimeric antigen receptor T cell (CAR-T) therapy. Their ability to target difficult to transfect cells and deliver genetic payloads that integrate into the host genome makes them ideal delivery candidates. However, several challenges remain to be addressed before LVVs are more widely used as therapeutics including low viral vector concentrations and the absence of suitable scale-up methods for large-scale production. To address these challenges, we have developed a high throughput microscale HEK293 suspension culture platform that enables rapid screening of conditions for improving LVV productivity [Gopal et al. Biotechnol. J.,16, e2000621, 2021]. High density culture (40 million cells/mL) of HEK293 suspension cells in commercially available media was achieved in microscale 96-deep well plate platform at liquid volumes of 200 µL (Figures 1 and 2). Comparable transfection and LVV production efficiencies were observed at the microscale and in conventional shake flasks and a 1-L bioreactor, indicating that significant scale-down does not affect LVV concentrations and predictivity of scale-up. Optimization of production step allowed for final yields of LVVs to reach 1.5x10⁷ TU/mL. The ability to test a large number of conditions simultaneously with minimal reagent use allows for the rapid optimization of LVV production in HEK293 suspension cells. Therefore, such a system may serve as a valuable tool in early-stage process development and can be used as a screening tool to improve LVV concentrations for both batch and perfusion-based systems. We also explored various methods to understand the impact of changing process conditions on product quality of LVV. During production of LVV a spectrum of particles are generated, Figure 3 indicates the possible sub-populations present and the assays that can be used for their detection. Therefore, combining such a high through put production system with commonly used high throughput characterization tools such as ELISA, RT-PCR, high throughput imaging based infectivity along with novel tools such as flow virometry (NanoFCM) proved to be a valuable screening tool in early-stage process development to gain insights into LVV product quality.
Current Collaborators:
Todd Przybycien and Steven Cramer - Rensselaer Polytechnic Institute
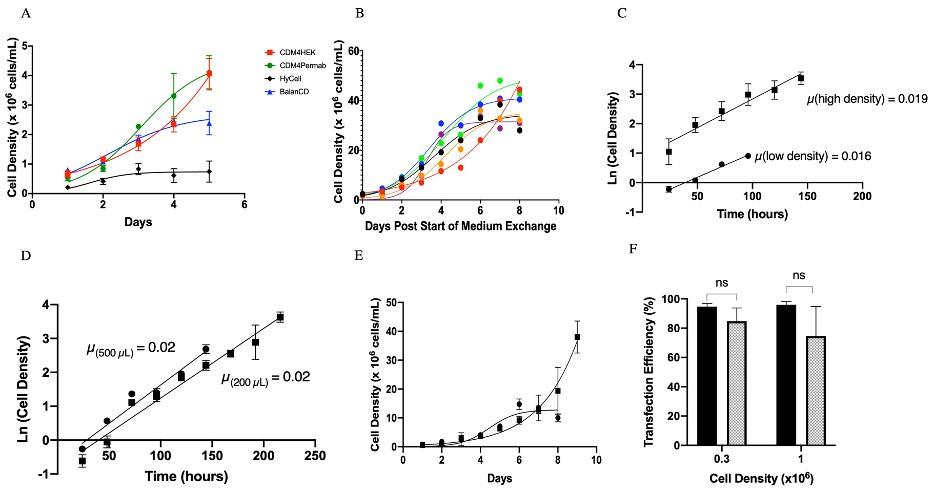
Figure 1. Influence of culture media on HEK293 suspension cell growth. (A) Cell growth in 125 mL shake flasks (30 mL liquid volume) by seeding 3 x 10⁵ cells/mL on day 0. Cell growth was evaluated in four different commercially available media: CDM4HEK293 (🟥), CDM4Permab (●), BalanCD HEK293 (▲), and HyCell TransfX (♦). A logistic growth curve model was fit through the data points. Error bars represent standard deviation across replicates. High Density HEK293 suspension cell growth in BalanCD HEK293. (B) Cells were grown in BalanCD HEK293 to high densities in 125 mL shake flasks (10 mL liquid volume). Medium exchange occurred daily after three days. A logistic growth line of best fit was drawn through the points. Each run of six replicates is shown. (C) Exponential growth for high-density (◼) and low-density (●) cultures of HEK293 suspension cells in 125 mL shake flasks (10 mL liquid volume). The slopes represent the growth rate (µ) of HEK293 suspension cells. (D) Exponential growth for high density cultures in 96-deep well plates at 500 µL (●) and 200 µL (◼). (E) Growth of HEK293 suspension cells in 96-deep well plates at 500 µL (●) and 200 µL (◼). A logistic growth line of best fit was drawn through the points. The error bars represent standard deviation across three replicates (N=3). (F) HEK293 suspension cells cultured in BalanCD HEK293 were transfected with a single pLV-EGFP plasmid at 3x10⁵ cells/mL and 1x10⁶ cells/mL in shake flasks (filled bars) and 96-deep well plates (dotted bars). The transfection efficiency of the cells was measured after 48 h using a flow cytometer. A students t-test was used to compare the transfection between shake flasks and 96-deep well plates at each density (* p<0.05, **p<0.01, ***p < 0.001, ****p < 0.0001, ns (not significant p > 0.05). Error bars represent standard deviation across three replicates (N=3). From Gopal et al. Biotechnol. J.,16, e2000621, 2021. From [Gopal et al. Biotechnol. J.,16, e2000621, 2021].
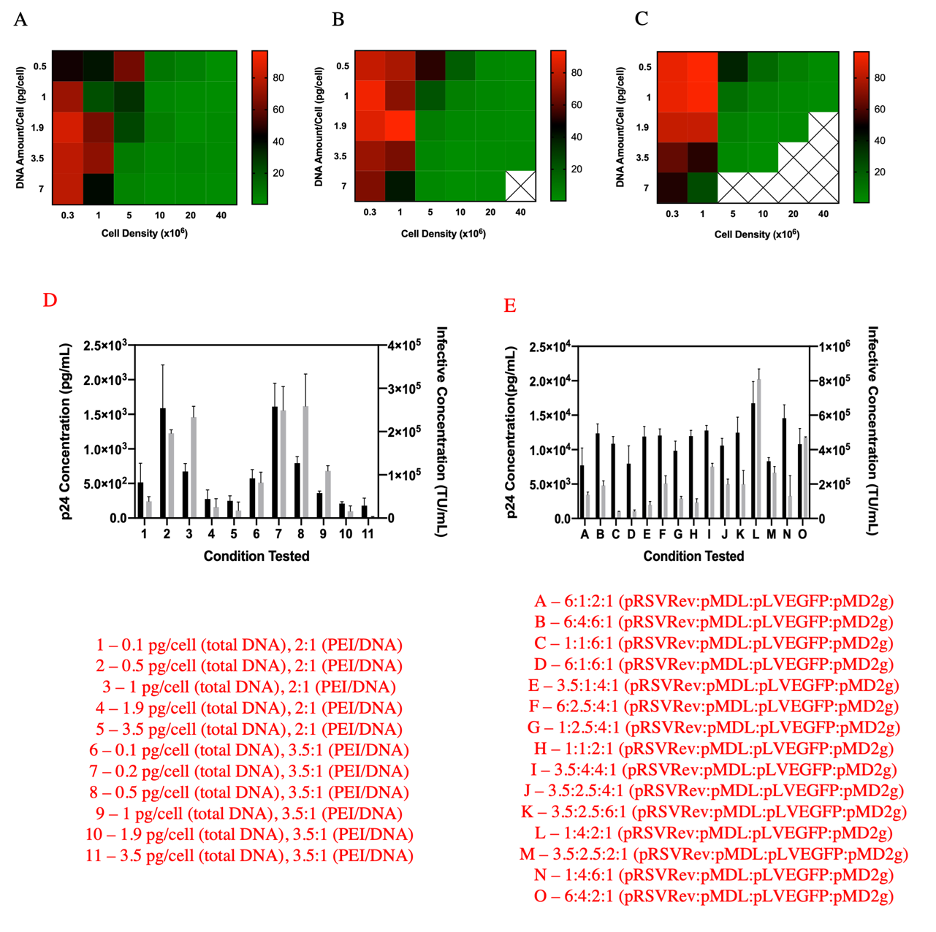
Figure 2. Transfection and LVV production optimization in HEK293 suspension cells performed in 96-deep well plates in duplicate. The three different PEI:DNA ratios of (A) 2:1, (B) 3.5:1 and (C) 5:1 are plotted as three separate heat maps. The redder the square the higher the transfection efficiency. X indicates conditions where no significant events were recorded due to cell death resulting from PEI toxicity. (D) Screen to identify optimal DNA amount/cell and PEI/DNA for lentivirus production at 2x10⁷ cells/mL. Both p24 concentration in pg/mL (gray bars) and infectivity in TU/mL (black bars) were measured. (E) Screen to identify optimal plasmid ratio (pRSVRev:pMDL:pLVEGFP:pMD2g) for lentivirus production at 2x10⁷ cells/mL. The conditions tested are shown to the right of the figures. The error bars represent standard deviation across three replicates. From [Gopal et al. Biotechnol. J.,16, e2000621, 2021].
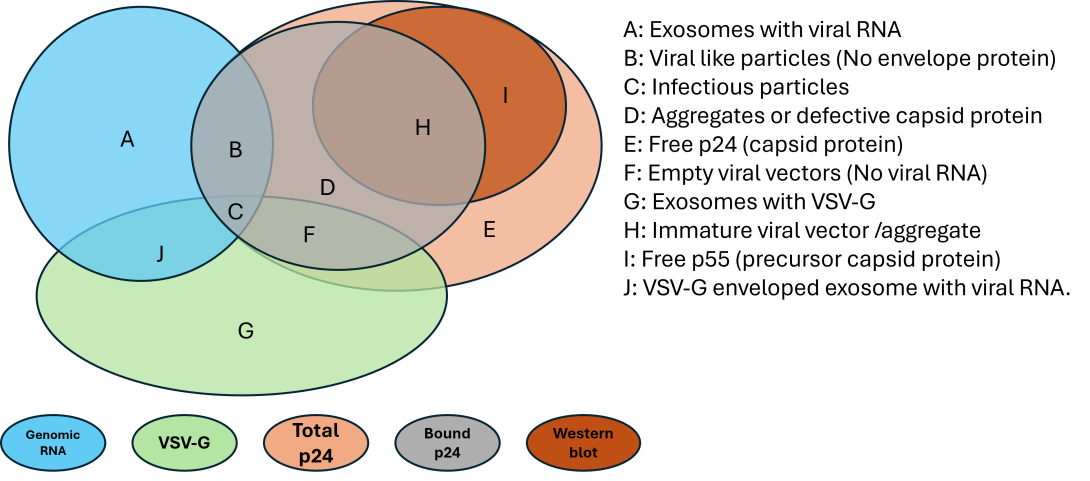
Figure 3. Venn diagram of common assays used for LVV titer and functional characterization with the populations of species to which they respond. Assays respond to both non-viral components and functional viral components, resulting in inaccurate determination of viral functional titer. The legend A-J on the right gives a description of all the species present during upstream production, with C being the desired fully functional viral vector. The colors indicated at the bottom describe specific assay measurements, and what species the assay can detect (e.g., vgRNA can detect the viral RNA associated with exosomes, VLPs, infectious particles) (vgRNA: genomic titer, VSV-G: envelope protein, p24: viral capsid protein, Bound p24: viral associated p24).