Circadian rhythms are characterized as oscillations that fluctuate based on a 24 h cycle and are responsible for regulation of physiological functions. While the internal clock synchronizes gene expression using external cues like light, a similar synchronization can be induced in vitro by incubating the cells with an increased percentage of serum followed by its rapid removal. Previous studies have suggested that synchronization of HepG2 cell line induced the rhythmic expression of drug metabolizing enzymes (DME) most specifically the cytochrome P450 enzymes [Narayanan et al. Biotechnol. Bioeng. 119, 2842-2856, 2022]. However, there is a lack of evidence demonstrating the influence of 3D microenvironment on the rhythmicity of these genes. To understand this interplay, gene expression of the circadian machinery and CYP450s were compared using the model human hepatocarcinoma cell line, HepG2. Upon serum shock synchronization, gene and protein expression of core clock regulators were assessed, and rhythmic expression of clock and CYP450 genes was demonstrated to be different in 3D vs. 2D (Figure 1). Using RNA sequencing, an in-depth understanding of the widespread effects of circadian regulation on genes involved in metabolic processes in the liver was obtained (Figure 2). This study is helping us gain a better understanding of chronopharmacokinetic events in humans using physiologically relevant 3D culture systems.

Figure 1. Time dependent expression of genes and proteins corresponding to CYP450 enzymes in synchronized HepG2 cells cultured as 3D spheroids. (A) Brightfield images of HepG2 spheroids on Day 0 and Day 1 of culture in Aggrewell plates at 4X magnification and 10X magnification, respectively. Serum shock protocol was performed on Day 2. (B) ECHO software-fitted plots determining the circadian nature of Bmal1, Clock, Cyp3a4, Cyp2d6 and Cyp2c9 and the non-circadian nature of Per2 with data presented as fold change in expression normalized to 18s rRNA expression and relative to ZT0. (C) Representative western blot images of CYP450s in synchronized HepG2 cells. Western blots were performed for each P450 enzyme three times and the housekeeping gene b-Actin was visualized on the same blot.
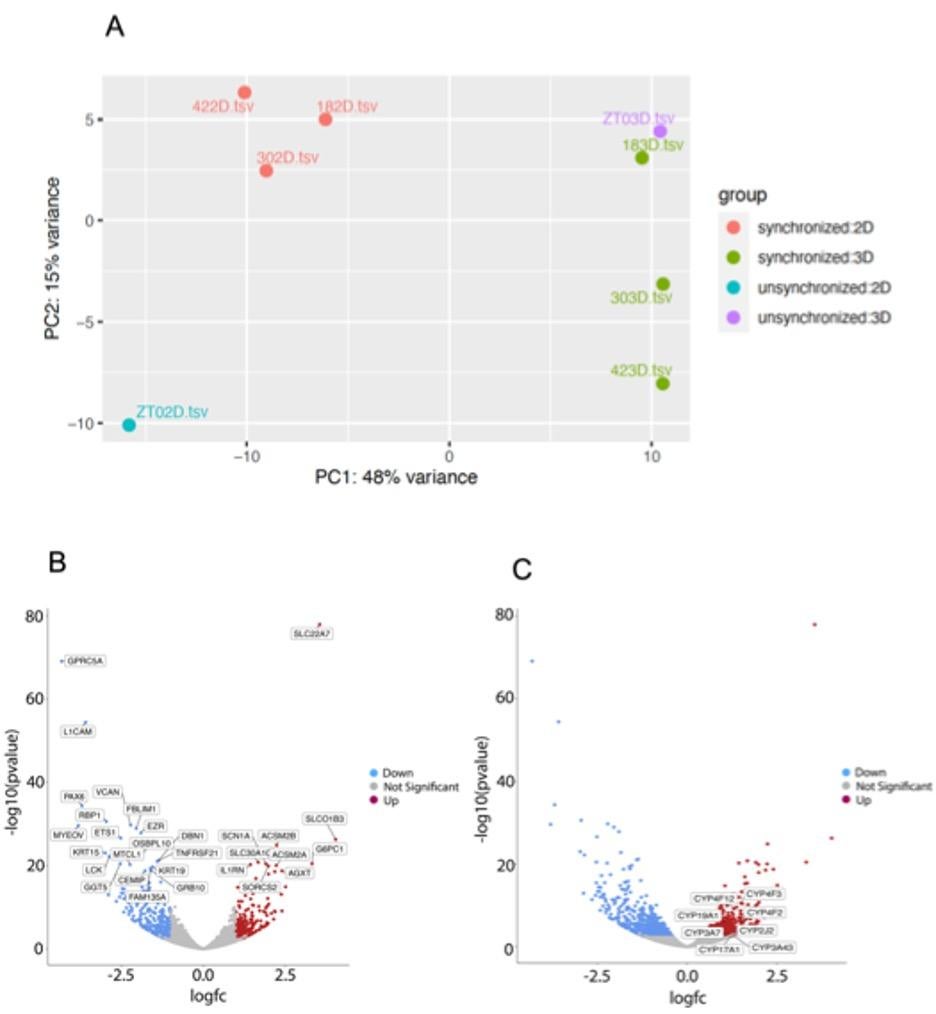
Figure 2. Transcriptome level changes induced by serum shock synchronization in 3D vs. 2D cell culture. (A) Principal Component Analysis (PCA) of the 2D and 3D samples associated with the oscillatory peak and trough of circadian gene expression; the x-axis depicts variance caused by cell culture method and the y-axis depicts variance caused by serum synchronization. (B) Volcano plot depicting the top 25 differential expressed genes in 3D HepG2 cells in comparison to 2D culture where the points in red indicate upregulated genes and the points in blue indicate downregulated genes. (C) Volcano plot indicating the upregulation of Cyp450 genes in 3D culture in comparison to 2D culture.