To develop a platform that is scalable to population-scale viral immune escape surveillance, we chose SARS-CoV-2 as our viral pathogen candidate. Pseudovirus surrogates bearing the spike protein of SARS-CoV-2 are ideal for studying interactions of SARS-CoV-2 with cell-surface receptors for viral entry.
We produced SARS-CoV-2 pseudovirus constructs containing the reporter plasmid expressing EGFP, a packaging plasmid, and the plasmid expressing the SARS-CoV-2 spike glycoprotein of interest, either Wuhan-Hu-1 or Omicron BA.4/5. These particles having infectious titers in the range of (4.7 ± 0.6) × 106 TU/mL for WT and (4.0 ± 0.9) × 106 TU/mL for Omicron BA.4/5, are then used in neutralization assays using human ACE2-expressing 293T cells on a 532-micropillar-microwell chip platform, with volumes as low as 1 µL per microwell. The pillar chip is seeded with ACE2 293T cells and stamped onto a well chip containing pseudovirus and different concentrations of test compounds followed by imaging after 48 h. We tested purified antibodies against the Wuhan-Hu-1 (WT) SARS-CoV-2 pseudovirus particles on-chip and determined their IC50 values. CC12.30 performed the best on the 532-chip, having an IC50 value of 0.14 ± 0.011 µg/mL, followed by CC12.14 (1.7 ± 0.055 µg/mL), T01KHu (6.6 ± 0.99 µg/mL), and PAb 40592-T62 (10.0 ± 1.6 µg/mL) (Figure 1A and B). We screened patient-derived sera and eluates from contrived Dried Blood Spots (cDBS) for activity against the WT (Figure 2A and B) and Omicron BA.4/5 strain (Figure 2C and D). Interestingly, some sera and cDBS eluates also inhibited cell-based infection by the BA.4/5 variant even though this variant began circulating a year after the serum and cDBS samples were collected, indicating the presence of cross-reactivity against distinct SARS-CoV-2 spike protein sequences. This chip-based platform may be used to perform high-throughput screening of the general population for existing immunity and immune escape of emerging viruses and their variants from prior infection and/or vaccination.
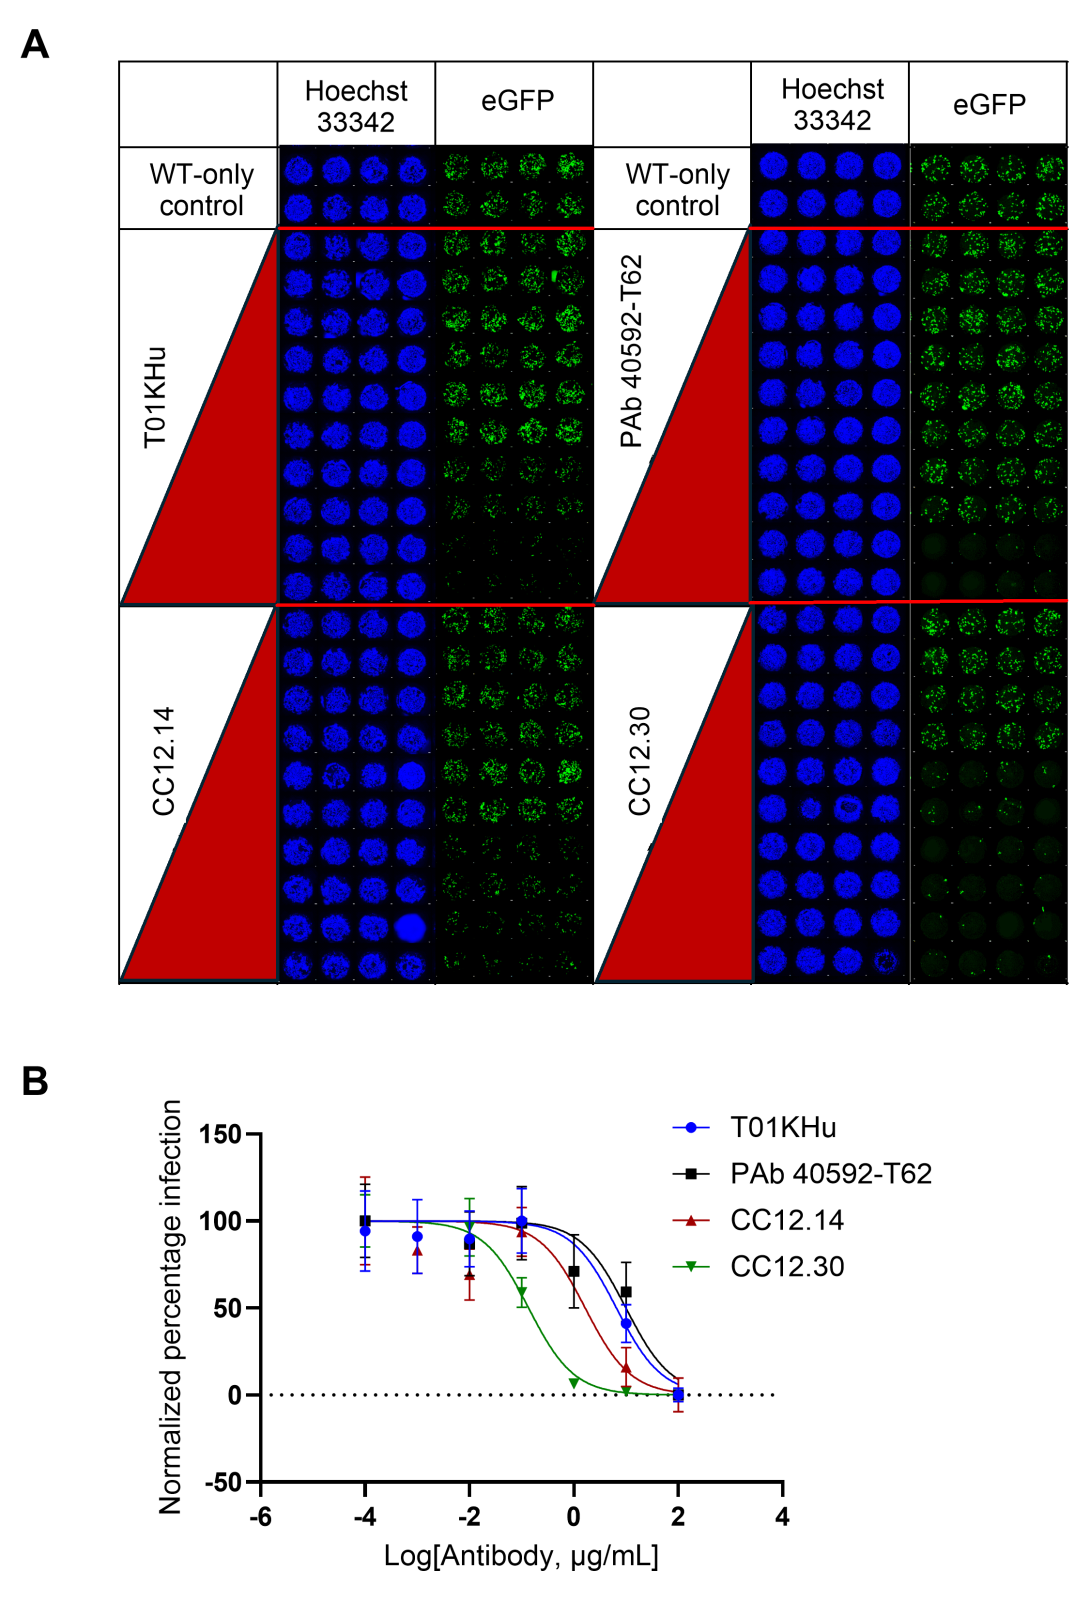
Figure 1. WT pseudoviral particle antibody-driven neutralization assay on the 532-chip platform. (A) Image array of two 532-pillar chips, with two antibodies screened per chip. Each spot shows human ACE2-HEK293T cells imaged at 10x magnification using Hoechst 33342 stain (blue) and its corresponding eGFP fluorescence image showing infected cells (green), on the pillar heads. The image array for each antibody shows the lowest antibody concentration (1-10 ng/mL) at the top and the highest tested concentration of 100 µg/mL at the bottom. All four antibodies tested yielded a decrease in infection with increasing concentration of antibody. (B) Dose response curves of antibodies against WT pseudoviral particles. The y-axis denotes the percentage of infected hACE2-HEK293T cells normalized against the conditions showing the highest and lowest fluorescence for each antibody. Error bars indicate mean ± SD from statistical analysis of n=22 technical replicates. Two biological replicates were performed for each antibody.
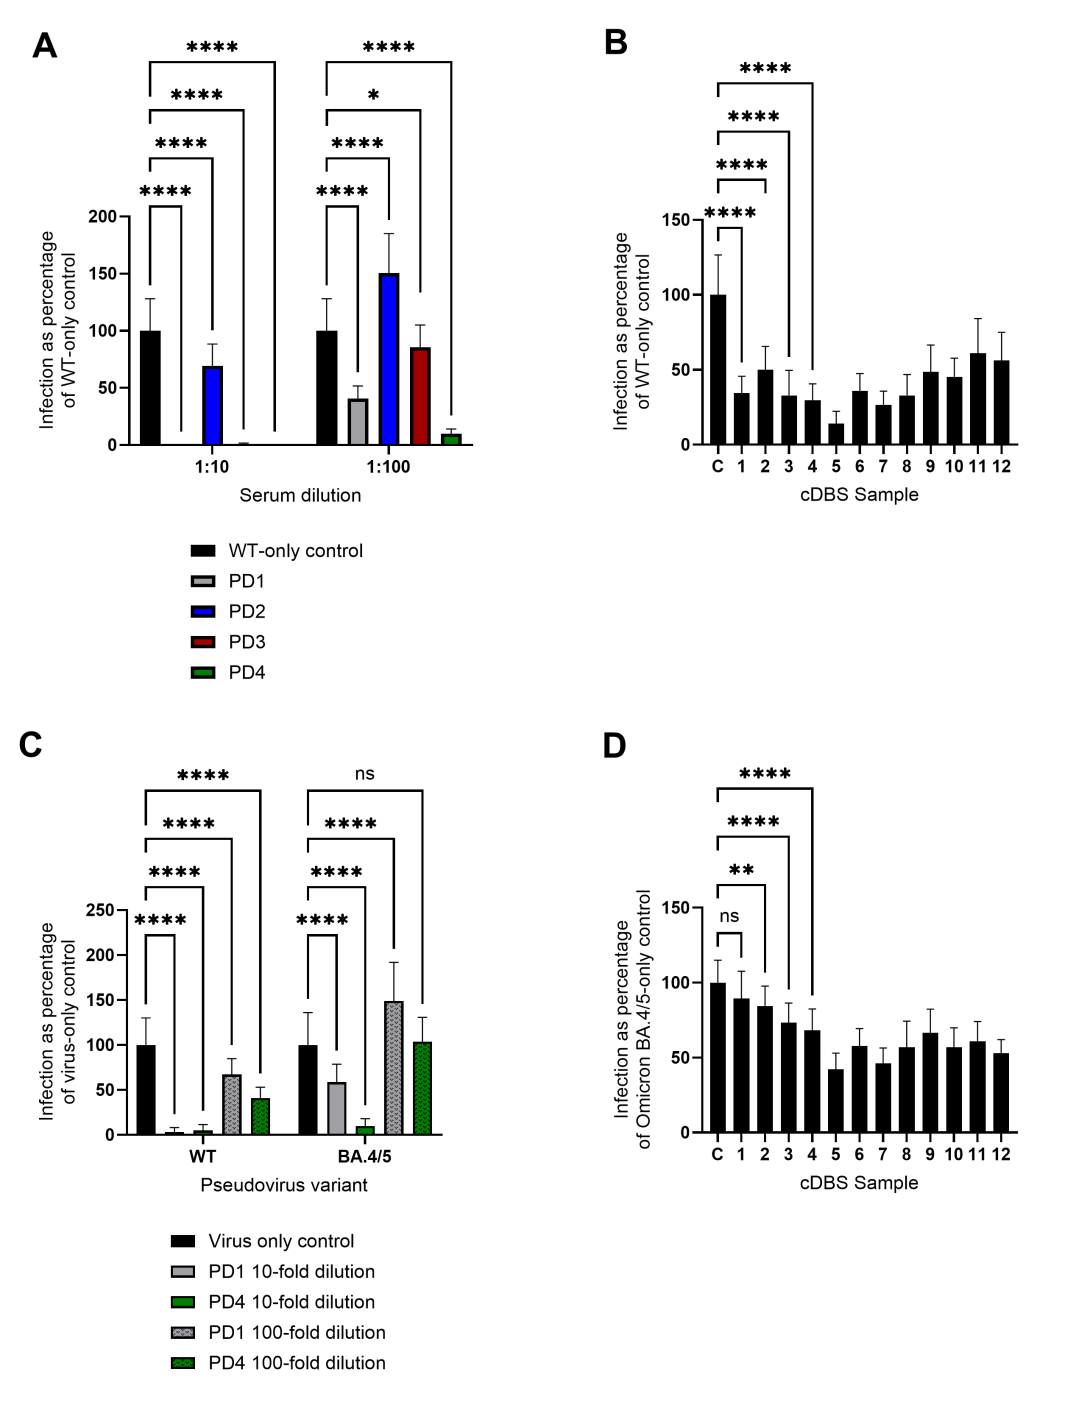
Figure 2. Screening of patient-derived sera and cDBS eluates against WT and Omicron BA.4/5 pseudoviral particle infection of hACE2-HEK293T cells normalized to pseudoviral particle-only control set at 100% infection. (A) Four patient-derived sera were tested against WT pseudoviral particles at 1:10 and 1:100 dilutions. Error bars indicate mean ± SD, from statistical analysis of n=22 technical replicates, detailed in the method details and statistical analysis section. **** p < 0.0001, * p ≤ 0.05, ns = p > 0.05 by two-way ANOVA. (B) WT pseudoviral particle neutralization assays on-chip using cDBS eluates, with C denoting pseudovirus particle-only control. Error bars indicate mean ± SD, from statistical analysis of n=22 technical replicates. **** p < 0.0001, ns = p > 0.05 by one-way ANOVA. Pairwise comparisons shown for the first four eluates; comparisons not shown are all p < 0.0001. (C) PD1 and PD4 were tested against WT and BA.4/5 pseudoviral particles at 1:10 and 1:100 dilutions on the same 532-pillar/well chip. Error bars indicate mean ± SD, from statistical analysis of n=22 technical replicates. **** p < 0.0001, ns = p > 0.05 by two-way ANOVA. (D) Omicron BA.4/5 pseudoviral particle neutralization assays on-chip using cDBS eluates, with C denoting pseudovirus particle-only control. Error bars indicate mean ± SD, from statistical analysis of n=22 technical replicates. **** p < 0.0001, ** p < 0.01, ns = p > 0.05 by one-way ANOVA. Pairwise comparisons shown for the first four eluates; comparisons not shown are all p < 0.0001.